
How to Collect Field Data on Power Poles
Introduction
Living in the information age, it can feel like there is a digital resource for everything. This is, of course, true in many ways; you can access a retailer’s entire inventory from your couch or track the weather patterns on a different continent. But there are gaps in the availability of certain data and the efficiency at which it can be obtained, and where there is a gap, there is assuredly a tech company attempting to fill it. One such gap is a lack of comprehensive field data on the physical infrastructure that makes up the electric grid–specifically, the 180 million distribution power poles in the U.S. that cover roughly 5.5 million line-miles.
As utility infrastructure ages and the grid becomes more complex, stakeholders need up-to-date field data to improve grid reliability and expand fiber internet access. From pole loading analysis and vegetation management to joint use permitting and OSP engineering, critical decisions in the industry hinge on high-quality data. However, the cost and time associated with traditional data collection methods are exceptional, and there is no single best method for establishing a robust digital twin of the grid’s physical infrastructure.
The following article outlines the pros and cons of the various power pole surveying methods used in the industry today, addressing their levels of accuracy, efficiency (or lack thereof), and costs. The article then moves to our approach and technology at Vulcan Line Tools, outlining why we collect 360° imagery and smart phone imagery for use in our proprietary software, Azmyth™.
Manual Ground Inspection
The simplest, most widespread method of field data collection is manual ground inspection. The process requires fielders to inspect power poles on foot–collecting imagery with a handheld camera, taking measurements with a hot stick or a calibration stick, and manually recording each pole’s coordinates and labeled information.
How to Survey Poles with a Hot Stick

A fielder uses a hot stick.
Using a hot stick is low-tech, but if you have the time, man-power, and tolerance for human error, it is effective. However, accuracy in pole measurement is crucial, and when measurement accuracy is wholly dependent on individual discretion, errors can occur. That said, the margin of measurement error can be diminished with higher-skilled employees and directives for them to work slowly and with care.
There are roughly 30 poles in a continuous mile, meaning that a pair of fielders who require roughly 6 minutes to walk between poles and take measurements will only field 10 poles in an hour. Depending on hours worked in a day, that's around 80 poles a day. At a median cost of roughly $.25/ft, a single mile will cost upwards of $1300, or $43.33/pole. Once the data is collected, it must be processed from multiple formats (pole photos, IDs as strings, measurements as integers or floats) into a single output. This is an inefficient process, especially for large projects. As a result, manual ground inspection with a hot stick is expensive, time consuming, and lacks stringent accuracy, though it does allow fielders to gather detailed information like pole birthmarks. It is only cost effective for small batches of targeted acquisition.
The Advantages of Surveying Poles with a Calibration Stick or Fielding App
Some companies have more efficient and accurate ground inspection methods, like entering measurements into a field collection app or using a calibration stick paired with a camera. These methods are more accurate, diminishing user error by digitizing the measurement process. Like a hot stick, the calibration stick is placed at the base of a pole and extended upwards, allowing the camera to measure attachment heights in reference to the stick. Further, companies with integrated software technologies can speed up the time required to upload and process data. However, costs for this method are higher, ranging from $.25/ft - $.50/ft ($43.33/pole to $88/pole), and fielders still must walk from pole to pole. As a result, expect fielders to address roughly 12 poles an hour, or 88 poles a day. If time is not an issue, these higher-tech ground inspection methods are beneficial because, despite their disadvantages, they can access every pole and will eventually get the job done.
We created our own manual collection technology, the Azmyth™ mobile device app, which you can read more about at the bottom of this article!
LiDAR
LiDAR is an exciting technology that uses lasers to create 3D models of physical objects. These sensors are placed on cars, tripods, or drones, scanning their surroundings with thousands of lasers per second. Once processed, LiDAR surveys create highly accurate, structural models of their surroundings called “point clouds.” In the context of the grid, a point cloud will contain a 3D model of anything ranging from power poles and transmission towers to substations. These models encompass entire areas, meaning a power pole and its surroundings will be present in the point cloud.

A LiDAR point cloud of an intersection.
How LiDAR is Used to Survey Power Poles
LiDAR offers some interesting use cases in the electric utility space. For example, a pole owner who needs up-to-date data on where to concentrate vegetation management efforts would benefit from the ability to view spans and their immediate surroundings at multiple angles. In another example, LiDAR data can be integrated into software like ArcGIS to create predictive models of a substation’s flood risk based on its location and surrounding topography.
While these cases are exceptional, the in-depth nature of a LiDAR point cloud is overkill for many users. If a telecommunication company needs to determine pole locations and attachment heights, they don’t need a 3D model of the entire area to do so. What’s more the sheer size of a point cloud, which ranges from a few MBs to hundreds of GBs, can limit its applicability in organizational workflows and existing systems. Another prohibitive factor is the substantial price tag of a LiDAR survey. Depending on the type of collection required, costs range from $.13 - $.26/ft for large land surveys and $.75 - $2.00/ft for targeted, highly accurate collections. To maintain the level of detail necessary for a comprehensive power pole analysis, a survey will cost $40-$80/pole. This includes both collection and processing costs.
Due to its mobility and speed of collection, LiDAR is an exceptionally efficient method for collecting field data. Traveling at highway speeds and adjusting for traffic and turnarounds, fielders can collect 50-100 miles of data a day. Drones aren’t as fast but they allow for targeted collections of tall structures and expansive surveys. Using a tripod for static collections is tedious, but it can fill the gaps that the vehicles or drones may have missed. While there are limiting factors to a point clouds’ accuracy, such as sensor noise, object reflectance and multiple returns of a single point, they are easily mitigated with skilled labor. LiDAR is clearly comprehensive, but it is important to remember that the objects in a point cloud do not contain measurements or inherent analytical data. They are 3D objects that can be analyzed but do not contain measurements without further analysis in platforms like AutoCAD or ArcGIS. Overall, LiDAR offers an accurate and efficient process for collecting structural data over large areas, but the needs of many companies who require power pole data fall below the scope of a point cloud.
Aerial Surveying
Aerial surveying is another interesting collection technique, involving the use of satellites, helicopters, or drones to capture overhead imagery. Aerial perspective is important for mapping field data and can be useful when planning routes or determining the length and directions of spans. However, there are limitations to this method like high costs, limited close-up details, and potential for regulatory restrictions. It is difficult to convert aerial survey costs to a per pole basis, but they cost around $2,000 per square mile. Google offers free satellite imagery that can be used within their terms of service, which is clearly cost competitive compared to ordering a survey.
It is much easier to buy already purchased satellite imagery than to collect it with a helicopter. Likewise, drone footage is good at capturing large areas efficiently but some areas have regulations that limit drone accessibility. Regardless of the method, aerial imagery offers great supplementary data, but without providing the potential for specific height measurements, its utility is limited.
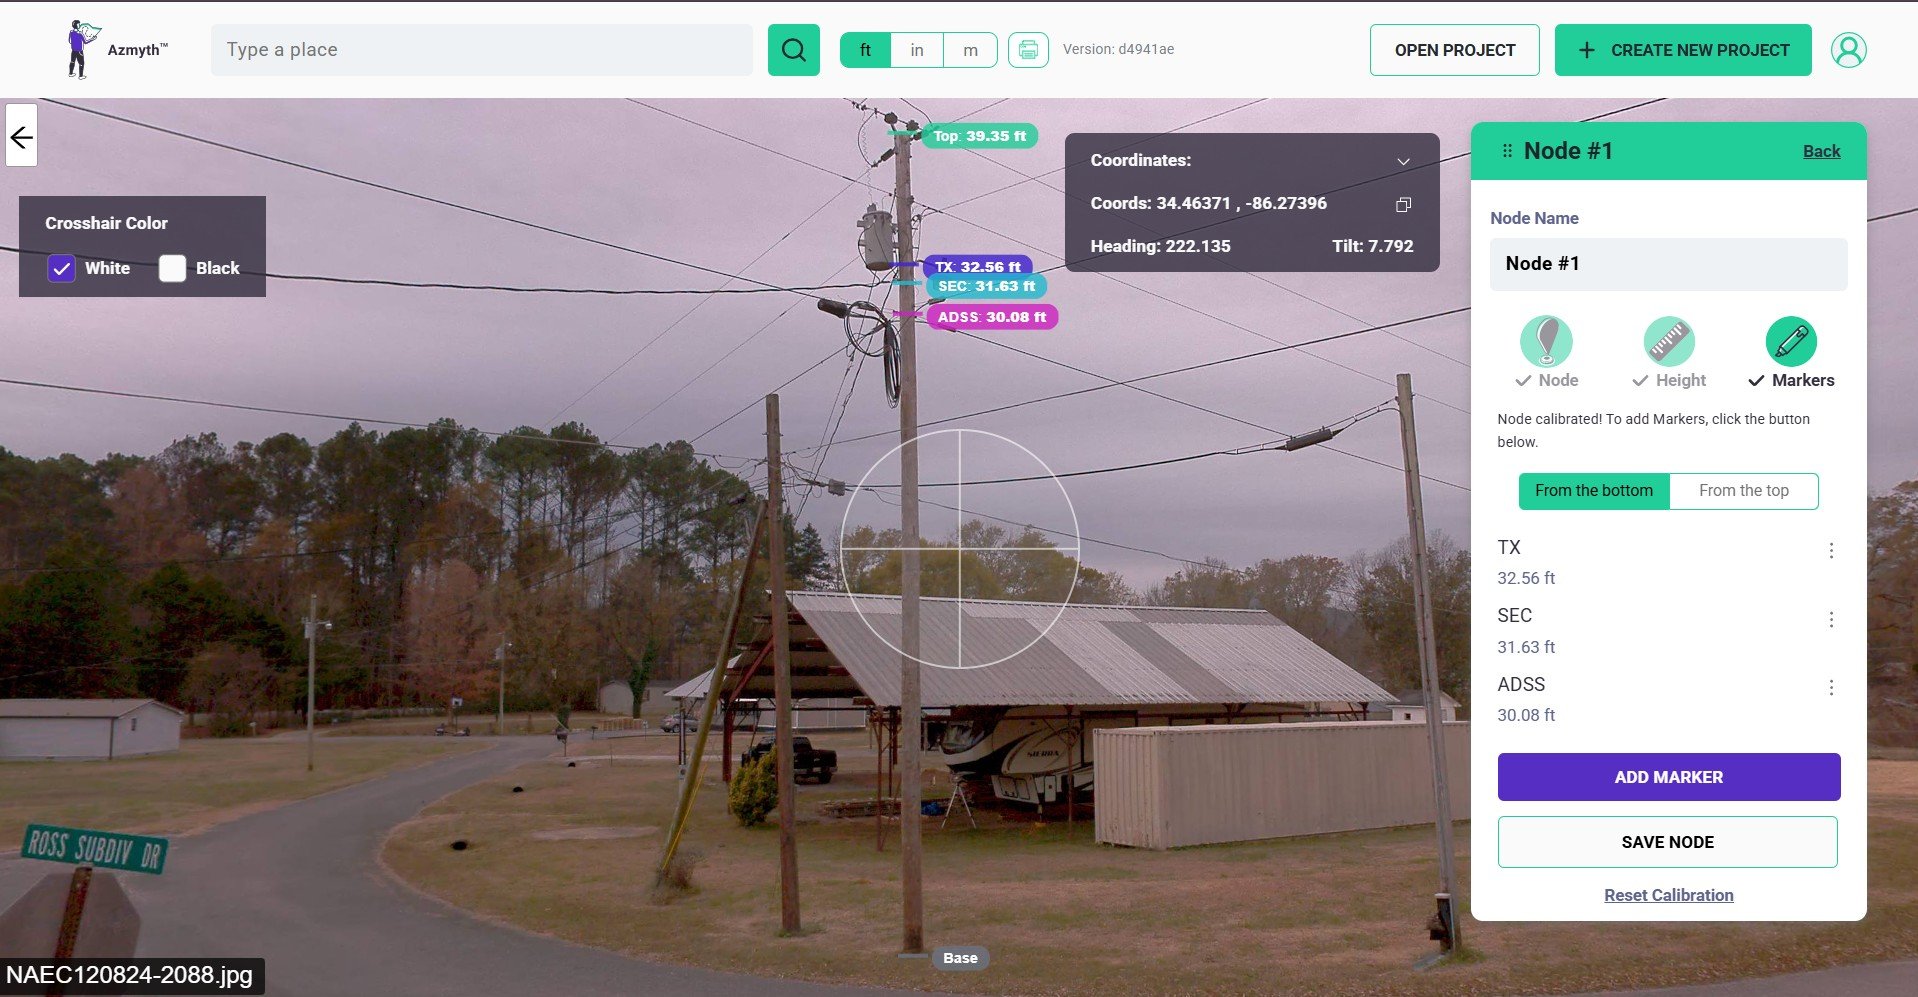
Our Approach: Azmyth™ and 360° Imagery
At Vulcan Line Tools, we wanted to find the most efficient way possible to collect accurate field data for power poles, and that is why we developed our proprietary software, Azmyth™. Azmyth™ allows users to shoot pole locations and heights, attachment heights, span lengths, and midspan clearances using 360° imagery. Azmyth™ is also integrated with satellite imagery, so nodes and midspans are easy to map and track from above.

A VLT fielding truck surveys a pole with a 360º camera.
Collecting High Quality Field Data
Our process is simple: we drive a car equipped with a 360º camera along power line routes to capture high-resolution, immersive images from all angles. Traveling at highway speeds and adjusting for traffic and turnarounds, our fielders collect around 150 miles of imagery a day (4,500 poles a day). Some of our customers opt to purchase this data outright, but for customers who want precise pole locations and measurements, we upload the data to Azmyth™ for further analysis.
Processing the data is easy: we sync the imagery with our RTK-corrected GPS measurements and upload it to Azmyth™ at a rate of 12,000 images/hour. Once in Azmyth™, our back-office team (or yours) extracts the precise locations and measurements of hundreds of poles a day. This data can then be stored as a KML, GeoJSON, or SHP file, allowing for seamless integration into existing workflows and databases. We also offer our customers access to Azmyth™, where they can view all of the data we collected for their area. Thanks to the efficiency of our collection method, we currently charge less than $.06/ft for both collection and analysis.
How to Survey Poles that Were Not Accessible From the Street
When our fielding vehicles are unable to access a pole that is down in a ditch or in the back of a lot, our fielders can manually inspect the pole with an iPhone or Android camera and upload the imagery through the Azmyth on Foot app. The app processes the image, stitches in each picture’s RTK-corrected GNSS data, and instantaneously uploads it to the software. As a result, fielders can acquire pole data in less than a minute, while back-office teams analyze that data in real-time.
A designer uses Azmyth™ to measure a pole.
Creating Exceptional Deliverables
One of the specific services we offer with Azmyth™ is the Red Yellow Green assessment. The assessment provides joint use attachers with detailed maps of pole locations and their attachment viability. Our designers label poles and midspans red, yellow, or green based on NESC clearance rules. We can complete this service for entire cities in a matter of days, so attachers can determine which routes are cost-efficient for make ready engineering and where they will likely need to go underground. We also offer a Joint Use Audit for pole owners who need a quick and affordable assessment of the companies who are attached to their poles and whether or not they are in violation. Unlike high-cost, inefficient alternatives, these streamlined services are a game changer for the industry due to their speed, accuracy, and affordability.
Conclusion
The grid is changing, and so are the needs of pole owners and attachers. There is no ‘best method’ for collecting field data on power poles–each comes with inherent advantages and disadvantages. While our method at Vulcan Line Tools is not the best option for collecting some specific information like pole birthmarks, it is meant for scale, meaning its efficient process and flexible outputs can satisfy the needs of any user requiring large volumes of high quality data. Whether you are expanding data to support asset management or targeting specific areas with nuanced objectives, it is adaptable and already employed by companies across the country. I encourage readers to explore how each of these technologies can enhance their infrastructure projects, improve safety, and reduce costs.
For More Information
To learn more about our data collection services, please visit our Data Collection page.
You can also get in touch with us by clicking the button below!